Please refer to important disclosures at the end of this report
1
1
2QFY20
2QFY19
% chg. (yoy)
1QFY20
% chg. (qoq)
Net Sales 1,249
1,032
21.0
1,575
(20.7)
Operating profit 72
55
29.8
115
(37.4)
OPM (%) 5.8
5.4
39bp
7.3
(153bp)
Adj. PAT 38
20
94.1
76.8
(50.6)
Source: Company, Angel Research
Blue Star's results came in above our expectations for 2QFY2020 on both top-
line and
bottom-line fronts. The company reported 21% yoy top-line
growth and PAT was up
94% yoy due to healthy sales and improvement in operating margin.
Healthy revenue growth across segments boost overall top-line growth:
The company’s
top-line grew 21% yoy at `
1,249cr due to healthy sales performance across segments.
The EMP business grew ~24% yoy driven by the execution of a healthy order book,
though at a slower pace. Further, Unitary Products business reported double digit
revenue growth i.e. ~10% yoy. Further, Room AC sales grew ~10% yoy,
in line with
industry growth and maintained its market share at
~12.5%. The revenue of
Professional Electronics and Industrial Systems business de-
grew ~53% yoy during the
quarter.
Adj. PAT de-grew ~94% yoy:
On the operating front, the company’s margins improved
by 39bps yoy .The bottom-line registered growth of ~94% yoy to `38cr due to h
ealthy
sales, operating performance and higher other income.
Outlook & Valuation: We estimate Blue Star to report top-
line CAGR of ~13% to
`6,651cr over FY2019-21E on the back of healthy demand
growth in Air Conditioning
and Unitary Products division. On the bottom-
line front, we estimate ~20% CAGR to
`269cr owing to improvement in volumes and better operating margins.
We maintain
our Buy recommendation on Blue Star with a Target Price of `980.
Key Financials
Y/E March (`cr)
FY2018
FY2019
FY2020E
FY2021E
Net Sales
4,648
5,235
5,866
6,651
% chg
6.0
12.6
12.1
13.4
Net Profit
144
188
215
269
% chg
17.0
30.5
14.5
24.5
OPM (%)
5.7
6.4
6.3
6.7
EPS (Rs)
15.0
19.6
22.4
27.9
P/E (x)
53.9
41.3
36.1
29.0
P/BV (x)
9.3
8.9
8.3
7.5
RoE (%)
17.3
21.5
23.1
25.8
RoCE (%)
16.7
21.2
24.1
27.3
EV/Sales (x)
1.7
1.5
1.3
1.2
EV/EBITDA (x)
30.3
23.9
21.0
17.4
Source: Company, Angel Research Note: CMP as of November 15, 2019
Blue Star Ltd
Performance Update
2QFY2020 Result Update | Cons. Durable
November 15, 2019
BUY
CMP `810
Target Price `980
Investment Period 12 Months
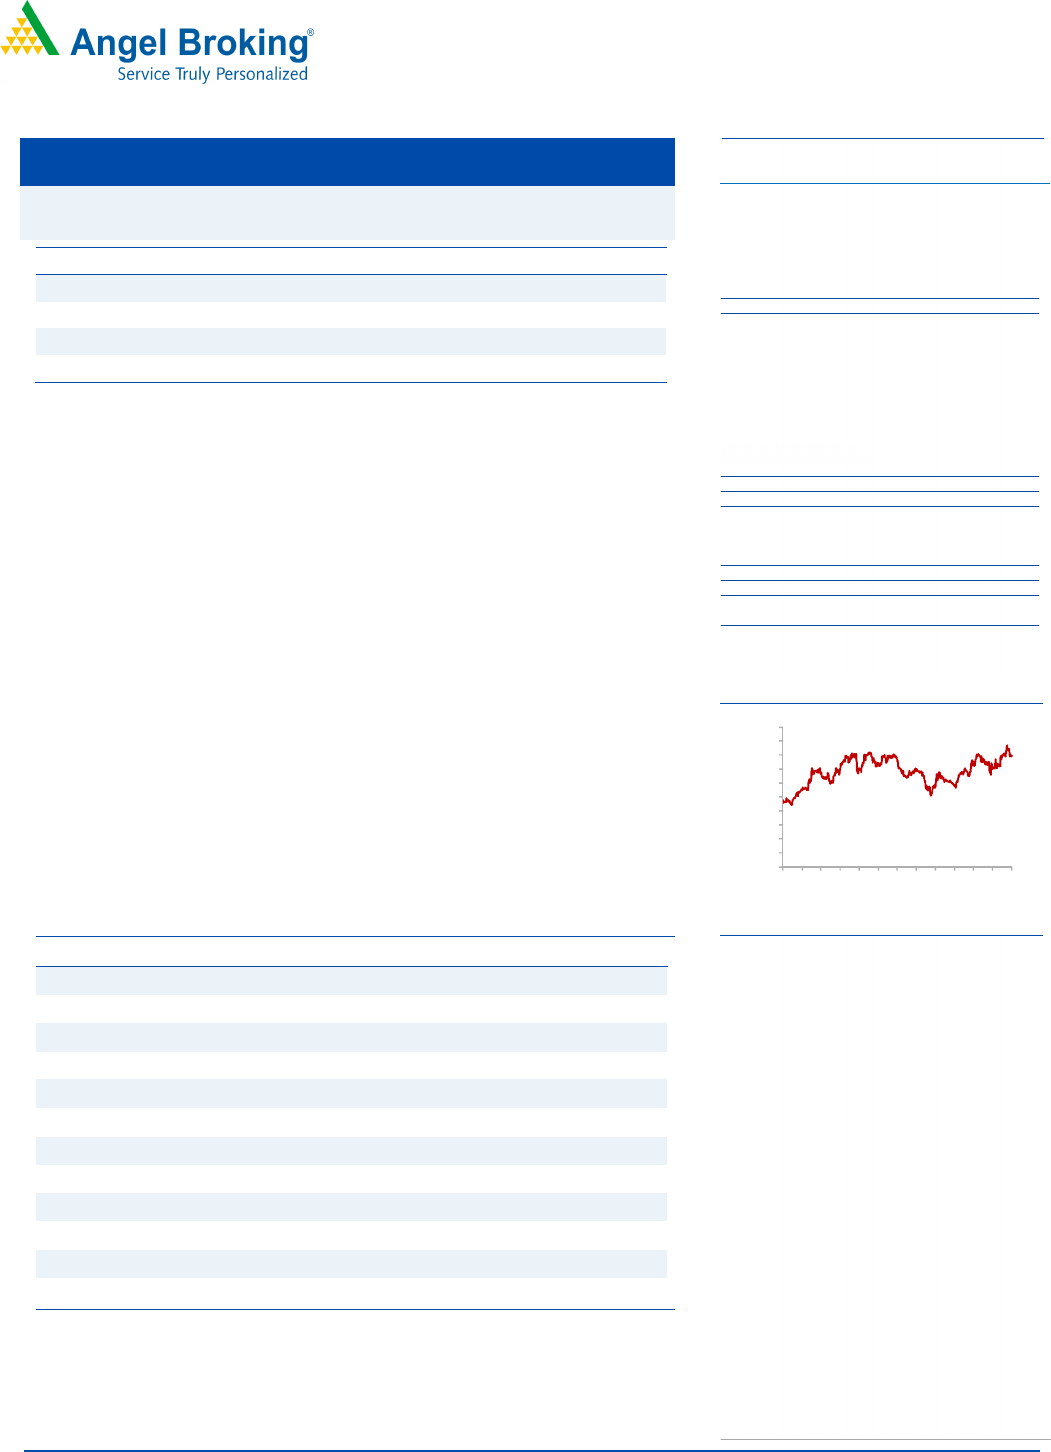
3-year price chart
Source: Company, Angel Research
Amarjeet S Maurya
022-39357800 Ext: 6831
amarjeet.maurya@angelbroking.com
Stock Info
Sector
232
Bloomberg Code
Shareholding Pattern (%)
Promoters 38.8
MF / Banks / Indian Fls 20.4
FII / NRIs / OCBs 12.8
Indian Public / Others 28.1
Abs.(%) 3m 1yr 3yr
Sensex 8.0 14.6 53.0
Blue Star 12.1 38.1 69.6
BLSTR IN
Face Value (
`
) 2
BSE Sensex 40,545
Nifty 11,944
9,549
Market Cap (` cr)
Net Debt (
`
cr)
BLUS.BO
Cons. Durable
7,780
Reuters Code
Beta 1.0
52 Week High / Low 881/560
Avg. Daily Volume
0
100
200
300
400
500
600
700
800
900
1000
Nov-16
Feb-17
May-17
Aug-17
Nov-17
Feb-18
May-18
Aug-18
Nov-18
Feb-19
May-19
Aug-19

Blue Star Ltd | 1QFY2020 Result Update
November 15, 2019
2
2QFY2020 Performance
Y/E March (` cr) 2QFY20
2QFY19
% chg. (yoy)
1QFY20
% chg. (qoq)
1HFY20
1H
FY19
% chg
Net Sales 1,249
1,032
21.0
1,575
(20.7)
2,825
2,540
11.2
Net raw material 934.1
773.79
20.7
1184.5
(21.1)
2119 1895
11.8
(% of Sales) 74.8
75.0 (21)
75.2
(43)
75.0 74.6
Employee Cost 119.5
103.07
15.9
115
4.2
234
206
13.8
(% of Sales) 9.6
10.0 (42) 7.3
229
8.3 8.1
Other Expenses 124.03
99.99
24.0
162
(23.2)
286
247
15.6
(% of Sales) 9.9
9.7 24
10.3
(33)
10.1 9.7
Total Expenditure 1,178
977
20.6
1,461
(19.4)
2,638
2,348
12.4
Operating Profit 72
55 29.8
115
(37.4)
187
192
(3)
OPM (%) 5.8
5.4 39 7.3
(153)
6.61 7.56
(95)
Interest 7
12 (41.8)
8
(17.5)
15 24
(36.8)
Depreciation 22
17 28.0
20
6.5
42 33
27.2
Other Income 11
5 115.0
22
(51.1)
32 23
37.6
PBT 54
32 70.5
108
(49.9)
162.00
158.71
2.1
(% of Sales) 4.3
3.1 40.8 6.8 5.7 6.2
Exceptional Items
Tax 17
8 115.3
33
(48.1)
49 40
22.5
(% of PBT) 31.2
24.7
30.1
30.5 25.4
Reported PAT before MI & Extra Ord. Items
37
24
55.7
75
(50.7)
113
118
(4.9)
PATM 3.0
2.3 4.8 4.0 4.7
Minority Interest 0
0 0 0
P/L of Ass. Co. 1
-4
1
2 -7
Extra-ordinary Items
Reported PAT 38
20 94.1
77
(50.6)
115
111
3.3
Source: Company, Angel Research

Blue Star Ltd | 1QFY2020 Result Update
November 15, 2019
3
Outlook & Valuation:
We estimate Blue Star to report top-line CAGR of ~13% to `6,651cr over FY2019-
21E on the back of healthy demand growth in Air Conditioning and Unitary Products
division. On the bottom-line front, we estimate ~20% CAGR to `269cr owing to
improvement in volumes and better operating margins. We maintain our Buy
recommendation on Blue Star with a Target Price of `980.
Downside risks to our estimates
Any slowdown in consumer segments like IT/ITES, healthcare, hospitality and
infrastructure could impact the company’s growth.
Foreign exchange fluctuations have a direct impact on the profit of the cooling
products division since commercial refrigerators are imported.
The RAC industry has been witnessing high traction and the company has been
able to outperform the industry over the past few years. Any unexpected drop in
performance of the RAC industry would pose a threat to our estimates.
Company Background
Blue Star Limited is an air-conditioning and commercial refrigeration company. The
company conducts various activities, such as electrical, plumbing and fire-fighting
services. Its segments include Electro-Mechanical Projects and Packaged Air
Conditioning Systems, and Unitary Products. The Electro-Mechanical Projects and
Packaged Air-Conditioning Systems segment includes central air-conditioning
projects, electrical contracting business and packaged air-conditioning businesses,
including manufacturing and after sales service. The Unitary Products segment
includes cooling appliances, cold storage products, including manufacturing and
after sales service. The company's products include central air conditioning, room
air conditioners and specialty cooling products. Its other businesses include
marketing and maintenance of imported professional electronic equipment and
services, as well as industrial products and systems, which is handled by Blue Star
Engineering & Electronics.

Blue Star Ltd | 1QFY2020 Result Update
November 15, 2019
4
Consolidated Profit & Loss Statement
Y/E March (` cr) FY2018 FY2019 FY2020E
FY2021E
Total operating income
4,648
5,235
5,866
6,651
% chg
6.0
12.6
12.1
13.4
Total Expenditure
4,382
4,901
5,496
6,205
Raw Material
3,229
3,931
3,989
4,523
Personnel
398
421
516
599
Others Expenses
756
548
991
1,084
EBITDA
266
334
370
446
% chg
19.6
25.6
10.6
20.6
(% of Net Sales)
5.7
6.4
6.3
6.7
Depreciation& Amortisation
64
75
86
95
EBIT
202
259
284
350
% chg
24.9
28.2
9.4
23.6
(% of Net Sales)
4.3
5.0
4.8
5.3
Interest & other Charges
29
48
33
27
Other Income
17
40
40
40
(% of PBT)
8.9
15.9
13.7
11.0
Share in profit of Associates
-
-
-
Recurring PBT
190
251
291
364
% chg
20.0
32.0
15.9
24.9
Tax
49
42
76
95
(% of PBT)
26.0
16.7
26.0
26.0
PAT (reported)
141
209
215
269
Minority Interest (after tax)
0
0
0
0
Profit/Loss of Associate Company
2
19
-
-
Extraordinary Items
5
2
-
-
ADJ. PAT
144
188
215
269
% chg
17.0
30.5
14.5
24.9
(% of Net Sales)
3.1
3.6
3.7
4.0
Basic EPS (`)
15.0
19.6
22.4
28.0
Fully Diluted EPS (`)
15.0
19.6
22.4
28.0
% chg
17.0
30.5
14.5
24.9

Blue Star Ltd | 1QFY2020 Result Update
November 15, 2019
5
Consolidated Balance Sheet
Y/E March (`cr)
FY2018
FY2019
FY2020E
FY2021E
SOURCES OF FUNDS
Equity Share Capital
19
19
19
19
Reserves& Surplus
812
854
912
1,019
Shareholders Funds
831
873
931
1,039
Minority Interest
2
2 1 1
Total Loans
376
348
245
245
Deferred Tax Liability
25
25
24
24
Total Liabilities
1,234
1,270
1,142
1,252
APPLICATION OF FUNDS
Gross Block
529
608
489
539
Less: Acc. Depreciation
137
208
294
389
Net Block
392
400
196
151
Capital Work-in-Progress
25
41
34
34
Investments
13
15
79
79
Current Assets
2,659
2,791
2,865
3,279
Inventories
833
869
932
1,057
Sundry Debtors
1,100
1,112
1,221
1,385
Cash
81
101
154
185
Loans & Advances
518
578
440
525
Other Assets
126
131
117
126
Current liabilities
1,974
2,110
2,163
2,424
Net Current Assets
685
681
701
855
Deferred Tax Asset
119
132
132
133
Mis. Exp. not written off
-
-
-
-
Total Assets
1,234
1,270
1,142
1,252

Blue Star Ltd | 1QFY2020 Result Update
November 15, 2019
6
Consolidated Cash flow Statement
Y/E March (`cr)
FY2018 FY2019 FY2020E
FY2021E
Profit before tax
206
251
291
364
Depreciation
64
75
86
95
Change in Working Capital
(194)
(43)
33
(123)
Interest / Dividend (Net)
22
34
33
27
Direct taxes paid
(45)
(35)
(76)
(95)
Others
(23)
(18)
0
0
Cash Flow from Operations
24
263
367
269
(Inc.)/ Dec. in Fixed Assets
(99)
(103) (50)
(50)
(Inc.)/ Dec. in Investments
7
33
0
0
Cash Flow from Investing
(93)
(70)
(50)
(50)
Issue of Equity
13
10
0
0
Inc./(Dec.) in loans
150
0
(103)
0
Dividend Paid (Incl. Tax)
(86)
(115) (129)
(161)
Interest / Dividend (Net)
(23)
(68)
(32)
(26)
Cash Flow from Financing
53
(173) (264)
(187)
Inc./(Dec.) in Cash
(16)
20
53
31
Opening Cash balances
97
81
101
154
Closing Cash balances
81
101
154
185

Blue Star Ltd | 1QFY2020 Result Update
November 15, 2019
7
Key Ratios
Y/E March
FY2018
FY2019 FY2020E
FY2021E
Valuation Ratio (x)
P/E (on FDEPS)
53.9
41.3 36.1
28.9
P/CEPS
37.9
27.3 25.8
21.3
P/BV 9.3 8.9 8.3 7.5
Dividend yield (%) 1.1 1.5 1.7 2.1
EV/Sales 1.7 1.5 1.3 1.2
EV/EBITDA
30.3
23.9 21.0
17.4
EV / Total Assets 6.5 6.3 6.8 6.2
Per Share Data (`)
EPS (Basic)
15.0
19.6 22.4
28.0
EPS (fully diluted)
15.0
19.6 22.4
28.0
Cash EPS
21.3
29.6 31.4
37.9
DPS 9.0 11.7 13.4
16.8
Book Value
86.6
90.9 97.0
108.2
Returns (%)
ROCE
16.7
21.2 24.1
27.3
Angel ROIC (Pre-tax)
18.1
23.5 30.1
34.4
ROE
17.3
21.5 23.1
25.9
Turnover ratios (x)
Asset Turnover (Gross Block) 8.8 8.6 12.0
12.3
Inventory / Sales (days)
65
61 58
58
Receivables (days)
86
78 76
76
Payables (days)
122
107 93
91
Working capital cycle (ex-
cash) (days)
30
31 41
43
Source: Company, Angel Research

Blue Star Ltd | 1QFY2020 Result Update
November 15, 2019
8
Research Team Tel: 022
-
39357800
E
-
mail: research@angelbroking.com Website: www.angelbroking.com
DISCLAIMER
Angel Broking Limited (hereinafter referred to as “Angel”) is a registered Member of National Stock Exchange of India Limited, Bombay
Stock Exchange Limited, Metropolitan Stock Exchange Limited, Multi Commodity Exchange of India Ltd and National Commodity &
Derivatives Exchange Ltd It is also registered as a Depository Participant with CDSL and Portfolio Manager and Investment Adviser with
SEBI. It also has registration with AMFI as a Mutual Fund Distributor. Angel Broking Limited is a registered entity with SEBI for Research
Analyst in terms of SEBI (Research Analyst) Regulations, 2014 vide registration number INH000000164. Angel or its associates has not
been debarred/ suspended by SEBI or any other regulatory authority for accessing /dealing in securities Market. Angel or its
associates/analyst has not received any compensation / managed or co-managed public offering of securities of the company covered
by Analyst during the past twelve months.
This document is solely for the personal information of the recipient, and must not be singularly used as the basis of any investment
decision. Nothing in this document should be construed as investment or financial advice. Each recipient of this document should make
such investigations as they deem necessary to arrive at an independent evaluation of an investment in the securities of the companies
referred to in this document (including the merits and risks involved), and should consult their own advisors to determine the merits and
risks of such an investment.
Reports based on technical and derivative analysis center on studying charts of a stock's price movement, outstanding positions and
trading volume, as opposed to focusing on a company's fundamentals and, as such, may not match with a report on a company's
fundamentals. Investors are advised to refer the Fundamental and Technical Research Reports available on our website to evaluate the
contrary view, if any
The information in this document has been printed on the basis of publicly available information, internal data and other reliable sources
believed to be true, but we do not represent that it is accurate or complete and it should not be relied on as such, as this document is for
general guidance only. Angel Broking Limited or any of its affiliates/ group companies shall not be in any way responsible for any loss
or damage that may arise to any person from any inadvertent error in the information contained in this report. Angel Broking Limited
has not independently verified all the information contained within this document. Accordingly, we cannot testify, nor make any
representation or warranty, express or implied, to the accuracy, contents or data contained within this document. While Angel Broking
Limited endeavors to update on a reasonable basis the information discussed in this material, there may be regulatory, compliance, or
other reasons that prevent us from doing so.
This document is being supplied to you solely for your information, and its contents, information or data may not be reproduced,
redistributed or passed on, directly or indirectly.
Neither Angel Broking Limited, nor its directors, employees or affiliates shall be liable for any loss or damage that may arise from or in
connection with the use of this information.
Ratings (Returns):
Buy (> 15%)
Accumulate (5% to 15%)
Neutral (
-
5 to 5
%)
Reduce (-5% to -15%) Sell (< -15%)
Note: We have not considered any Exposure below ` 1 lakh for Angel, its Group companies and Directors
Disclosure of Interest Statement
Blue Star
1. Financial interest of research analyst or Angel or his Associate or his relative No
2. Ownership of 1% or more of the stock by research analyst or Angel or associates or relatives No
3. Served as an officer, director or employee of the company covered under Research No
4. Broking relationship with company covered under Research No